Phoenix Area Real Estate and Community News

Aug. 13, 2026

Greater Phoenix Market Report (Sept 2026): Is Your Home Ahead of Inflation?


Greater Phoenix Market Report · September 2026

Your home didn’t just get more expensive. It got more valuable.

Most market updates look back a few months. We looked back ten years — and adjusted every number for inflation, so you can see what your home actually gained.

The short version
  • Over the last ten years, every size of home in Greater Phoenix gained real value — even after you account for inflation.
  • For the most common home sizes, that’s roughly 34% to 36% ahead of inflation. Your home didn’t just keep up. It got ahead.
  • The last four years look softer, but that’s because 2022 was the top of a frenzy. Measuring from a peak makes almost anything look like a decline.

If you own a home, you’ve probably noticed that market news is confusing. One month prices are up. The next month they’re down. None of it tells you much about the house you actually live in.

So this month we did something different. Instead of looking at the last few months, we looked at the last seven and ten years — and we adjusted every figure for inflation.

That second part is what makes this worth reading.

· Start Here

What “after inflation” actually means

Everything costs more than it did in 2016. Groceries, gas, a car, a gallon of paint. So a price from 2016 and a price from 2026 aren’t really measured in the same money.

Adjusting for inflation puts both numbers in today’s dollars, so you’re comparing like with like.

The difference in one line

On paper is what the price tag says. After inflation is what it’s really worth once you account for the fact that money buys less than it used to.

If a home’s value only kept pace with inflation, it would have broken even — more expensive, but no more valuable. Anything above that is a real gain.

This matters because it’s the difference between a number that looks good and a number that is good. Both are below.

· How We Grouped Things

Why this report sorts homes by size, not by price

Most market reports group homes into price ranges. Over a long stretch of time, that quietly breaks.

Here’s why. A home that sold for $300,000 in 2016 might sell for $600,000 today. It moved into a completely different price category without changing at all. Follow price ranges over ten years and you end up tracking the categories, not the houses.

Size doesn’t do that. A 1,900 square foot home is still 1,900 square feet ten years later. So grouping by size gives a much fairer picture over a long period.

These figures also use the median price per square foot rather than the sale price. It’s a steadier measure, because it doesn’t swing just because bigger or smaller homes happened to sell that month.

· The Main Finding

Every size of home is ahead of inflation over ten years

This is the number that matters most if you already own your home. Find your size in the left column.

Home size Since Aug 2016
after inflation
Since Aug 2019
after inflation
Under 1,500 sq ft +49.2%3rd +23.6%5th
1,501–2,000 sq ft Most common +35.6%6th +20.9%7th
2,001–2,500 sq ft Most common +34.3%7th +22.5%6th
2,501–4,000 sq ft +38.8%5th +30.0%4th
4,001–6,000 sq ft +64.6%2nd +54.4%2nd
6,001–10,000 sq ft +68.7%1st +65.4%1st
Over 10,000 sq ft +44.4%4th +30.9%3rd

Change in median price per square foot, Greater Phoenix single-family detached homes, adjusted for inflation and expressed in June 2026 dollars. Rankings compare the seven size groups against each other.

Every single number in that table is positive. That’s the headline.

If your home’s value had only kept pace with inflation over the last ten years, you’d have broken even. Homes in the most common sizes did about 34% to 36% better than breaking even.

That’s real, spendable value — not a bigger number that inflation ate. And it held true for every size group, top to bottom.

· The Bigger Numbers

On paper, the gains look even larger

These are the same homes over the same periods, without the inflation adjustment. This is what the price tags actually did.

Home size Since Aug 2016
on paper
Since Aug 2019
on paper
Under 1,500 sq ft +116.2%3rd +64.9%5th
1,501–2,000 sq ft Most common +96.3%6th +61.1%7th
2,001–2,500 sq ft Most common +94.3%7th +63.1%6th
2,501–4,000 sq ft +101.4%5th +73.4%3rd
4,001–6,000 sq ft +138.9%2nd +105.8%2nd
6,001–10,000 sq ft +142.7%1st +120.3%1st
Over 10,000 sq ft +106.5%4th +71.8%4th

Same measure, not adjusted for inflation. Most homes more than doubled in price over the ten-year period.

Most homes more than doubled on paper since 2016. The inflation-adjusted table above is the more honest read — but both are true, and the gap between them is simply how much the dollar changed.

· The Last Four Years

Why the recent numbers look different

If you’ve felt like the market has been flat or sliding since 2022, you’re not imagining it. But the reason matters.

2022 was the top of a frenzy. Homes were getting dozens of offers. When you measure from the highest point a market has ever reached, almost everything after it looks like a decline — by definition, not by weakness.

It’s worth remembering who was buying in the first half of 2022, too. A large share of purchases in those months were made by iBuyers and institutional investors rather than ordinary families, who could barely get an offer accepted.

Here’s what has happened since that peak, after inflation:

Home size Since Aug 2022
after inflation
Since Aug 2022
on paper
Under 1,500 sq ft −16.0%6th −3.5%6th
1,501–2,000 sq ft Most common −16.6%7th −4.2%7th
2,001–2,500 sq ft Most common −13.7%5th −0.9%5th
2,501–4,000 sq ft −8.6%3rd +5.1%3rd
4,001–6,000 sq ft +1.8%2nd +17.5%2nd
6,001–10,000 sq ft +15.6%1st +32.4%1st
Over 10,000 sq ft −11.0%4th +0.5%4th

Notice the difference between the two columns. On paper, most homes are close to flat since 2022. The larger declines only appear once you adjust for inflation — which is another way of saying the dollar moved more than the house did.

Put the two views together and the picture is straightforward: a soft four years inside a very strong decade.

· By Size

Larger homes have held up best

One clear pattern runs through every period we looked at: bigger homes appreciated more.

Homes between 6,001 and 10,000 square feet finished first in every single measurement — ten years, seven years, and since 2022.

  • Since 2016: up 142.7% on paper, and still up 68.7% after inflation.
  • Since 2019: up 120.3% on paper, and up 65.4% after inflation.
  • Since 2022: up 32.4% on paper, and up 15.6% after inflation — the only group with a meaningful real gain since the peak.

Homes between 4,001 and 6,000 square feet came second over both long periods, and were the only other group to stay positive after inflation since 2022.

Homes over 10,000 square feet did not keep pace with the two groups below them. That said, very few homes that large change hands in any given year, so those figures move around more than the rest of the table and are worth treating as a rough indication rather than a firm trend.

· If You’re Buying

Smaller homes have become genuinely more affordable

The same numbers that look soft for a seller look quite different from the other side.

Homes under 2,000 square feet are down roughly 16% to 17% after inflation since 2022. Over that same stretch, Cromford reports that median incomes have grown substantially.

Put those together and buying power at the entry level has improved in a real way compared with the peak — particularly for anyone who was priced out during the 2021 and 2022 scramble.

· The Fine Print

What these numbers do and don’t cover

A few things worth knowing so you can read the tables accurately:

  • Single-family detached homes only. Condos, townhomes and similar were left out, because they’ve lost market share over this period and including them would skew the comparison.
  • All figures are median price per square foot for Greater Phoenix as a whole — not any one neighborhood, and not your specific home.
  • Inflation-adjusted figures are expressed in June 2026 dollars, using the Consumer Price Index.
  • All comparisons run August to August, which keeps seasonal differences out of the picture.
  • Teardowns can distort things in a couple of areas. In Paradise Valley and Arcadia, roughly 16% to 18% of sales involve knocking a home down and building something far grander in its place. Everywhere else in Greater Phoenix, that’s under 1.3% of sales. Median price per square foot is the measure least affected by this, which is part of why it was used.
· The Takeaway

What this means for you

If you own your home, the ten-year view is the one that describes your situation. Your home has gained real value — not just a bigger number, but genuine value that outpaced inflation. The last few years have been flat, and that’s normal after a peak like 2022.

If you’re thinking about buying, especially something under 2,000 square feet, your money goes further now than it did at the top of the market.

And if you’re weighing a move, the honest answer is that none of these numbers describe your house specifically. They describe a metro area of several million people. What your home is worth depends on your neighborhood, your size, your condition and your street.

Curious what your home is actually worth?

We’ll put together a real valuation based on recent comparable sales near you — not a website estimate, and not a metro-wide average.

Get Your Home Evaluation
Source & disclosures
  • Analysis of data published by the Cromford Report, “Price Analysis: Part Three — A Longer-Term View,” August 12, 2026. Figures cover Greater Phoenix single-family detached homes, measured by median price per square foot.
  • Inflation adjustments use the Consumer Price Index, with all dollars expressed in their June 2026 value.
  • Income growth referenced in the buying section is as reported by the Cromford Report.

These figures describe the Greater Phoenix market overall and are not a substitute for an analysis of any specific property. Market conditions change; figures are current as of the publication date above.

Posted in Real Estate News
Aug. 12, 2026

Ahwatukee Real Estate Market Report 2026 | Prices & Trends

Ahwatukee Market Report  ·  85044 · 85045 · 85048

The Ahwatukee Real Estate Market in 2026 — and What the Numbers Actually Mean

Current market data for the Ahwatukee real estate market — median price, inventory, days on market and months of supply across 85044, 85045 and 85048 — followed by the analysis almost nobody publishes: what those numbers look like once you adjust for inflation, and what that means if you own here.

What is the Ahwatukee real estate market like right now?

Ahwatukee is a seller's market at roughly 2.0 months of supply, but a softening one. Active inventory has risen sharply year over year while median sold price has eased. Homes that are priced correctly still sell quickly and close at about 99% of list price, so pricing strategy matters more than market direction right now.

Ahwatukee market snapshot

Metric Current Year over year What it means
Median sold price Mid-$500Ks Easing Down modestly from a year ago; 2026 year to date runs higher than the latest month
Median list price Above median sold Up The gap usually reflects listing mix, not sellers overreaching across the board
Sale-to-list ratio ~99% Flat Buyers are not grinding sellers down. They are declining to engage with overpriced homes
Active listings Sharply higher Up substantially The single biggest change in this market. More choice for buyers
Months of supply ~2.0 Roughly flat Under 4 months is a seller's market. Demand is absorbing the new inventory
Days on market See below Mixed This figure is widely misquoted. The distinction matters — see the next section

Figures refreshed monthly from ARMLS. Market data is revised as transactions close and late reporting lands. Ahwatukee is also three ZIP codes that do not move together, so a single blended figure will always be an approximation of whichever part of the market you actually own in.

Is Ahwatukee a buyer's or seller's market?

Technically a seller's market. Months of supply sits near 2.0, and anything under about four months favors sellers. But inventory has climbed steeply from a year ago, which gives buyers more choice and makes them far more selective about initial asking price than they were in 2021 or 2022.

That combination — tight supply on paper, choosier buyers in practice — is why the market feels contradictory to people living in it. Sellers hear "seller's market" and expect 2021 conditions. Buyers see rising inventory and expect leverage. Both are partly right, and the sale-to-list ratio near 99% is the number that reconciles them: homes are not selling below asking, they are simply not selling at all if the asking price is wrong.

85044, 85045 and 85048 do not behave the same way

Most published Ahwatukee statistics blend all three ZIP codes into one number. That is convenient and slightly misleading.

  • 85044 covers the older, established northern section. Larger lots in places, more original-condition homes, and the longest average ownership tenure of the three — which means the most accumulated equity.
  • 85045 is the smallest and newest of the three, in the far south. Newer construction, fewer transactions, and thinner comparable sets, so individual sales move the statistics more than they should.
  • 85048 covers the Foothills. Strong school-boundary demand and the highest transaction volume of the three, which makes its numbers the most statistically reliable and the least representative of the others.

If you are trying to work out what your own home is worth, the blended Ahwatukee median is close to useless. What matters is recent sales in your ZIP code, your price band, and your home's configuration.

Are Phoenix home prices down?

In nominal dollars, Phoenix home prices are down about 5.6% from their June 2022 peak. Adjusted for local inflation, the decline is roughly 14%. Prices did not fall that far — the dollar lost purchasing power at the same time, which widens the real decline well beyond the headline number.

The two numbers nobody separates

Every homeowner in Ahwatukee has watched an online estimate move up and down and wondered which number to trust. The problem is that almost every published figure measures only one thing: the raw dollar price.

A dollar in 2022 and a dollar in 2026 are not the same unit. When you compare a 2022 price to a 2026 price without adjusting for that, you are measuring with a ruler that changed length partway through.

Economists solve this by restating past prices in today's dollars. The result is called a real, or inflation-adjusted, price. It is the standard method for comparing values across time, and it produces a very different picture of the Phoenix market than the headlines do.

What does inflation-adjusted home price mean?

An inflation-adjusted home price restates past prices in today's dollars, so values from different years can be compared fairly. It answers what a home is worth in real purchasing power rather than in raw dollars, separating genuine value change from the effect of general price inflation.

A worked example: a home that sold for $500,000 in mid-2022 and is worth $500,000 today has not held its value. Local prices rose roughly 10% over that period, so holding the same dollar figure means the home lost about 10% in real terms. The number on the listing stayed still; the value underneath it moved.

The calculation, step by step

Here is the full working, so you can check it rather than take it on faith.

  1. Start with the nominal change. The S&P Cotality Case-Shiller AZ-Phoenix Home Price Index peaked at 343.55 in June 2022. As of February 2026 it stood at 324.28. That is a nominal decline of 5.6%.
  2. Measure local inflation over the same window. The Consumer Price Index for the Phoenix-Mesa-Scottsdale area rose roughly 9% to 12% between mid-2022 and early 2026, depending on the exact months compared.
  3. Divide one by the other. A 5.6% nominal decline against 9–12% inflation produces a real decline of roughly 13% to 16%, centring near 14%.

Why a range and not a single number: BLS publishes the Phoenix-area CPI as a bimonthly and annual series rather than monthly, so pinning the exact June 2022 index value requires interpolation. Anyone quoting a precise inflation-adjusted figure to the decimal is overstating the precision the underlying data supports. The direction and the rough magnitude are solid; the second decimal place is not.

What if you bought in 2022?

If you bought at or near the 2022 peak, you are likely close to flat in nominal terms and modestly behind in real terms. That is a genuine cost, but it is usually smaller than owners assume — because most people track the value going up and never track the loan going down.

Every mortgage payment since closing has moved principal, and the share going to principal grows every month. It is the least visible line on your balance sheet and one of the most consistent. Nothing the market does can reverse it. Over three or four years it accumulates into a figure that meaningfully offsets a flat price — and it is the number almost nobody includes when they estimate where they stand.

There is a second point worth sitting with, and it matters more than the first:

Buying near a peak only costs you if you sell near a trough. Most owners never do. And if your next home is also in Ahwatukee, you would be selling and buying in the same market — the same conditions that soften your sale price soften your purchase price too. A down market is only bad news for someone leaving the market entirely.

The practical read for a 2021–2024 buyer is usually not "stuck." It is further along than expected, and moving the right way every month regardless of what prices do next. Whether that is enough to act on depends on where you are trying to go, not on where the index sits.

What the local, unrestricted data shows

The Federal Housing Finance Agency publishes a house price index for the Phoenix-Mesa-Chandler metro area built from actual sale and appraisal records. Unlike Case-Shiller, it is public-domain government data, so it can be republished and charted freely.

500505510515520525Q1 2025Q2 2025Q3 2025Q4 2025Q1 2026Nominal index  +2.4% over the yearInflation-adjusted  −0.6% over the yearIndex (1995 Q1 = 100)
Phoenix-Mesa-Chandler house price index, nominal vs. inflation-adjusted. Source: U.S. Federal Housing Finance Agency, All-Transactions House Price Index [ATNHPIUS38060Q], retrieved from FRED, Federal Reserve Bank of St. Louis. Real series deflated using Phoenix-area CPI-U (BLS). Public-domain data.

The pattern holds even over a single recent year. Between the first quarter of 2025 and the first quarter of 2026, the index rose from 507.81 to 519.93 — a nominal gain of 2.4%. Phoenix-area inflation over roughly the same period ran about 3.0%. In real terms, that 2.4% gain is a decline of about 0.6%.

A rise on paper. A slight loss in purchasing power. Both statements are true, and only one of them usually gets reported.

Did my Ahwatukee home lose value?

Most likely not in dollar terms. The Ahwatukee median sale price in July 2026 was about $550,000, close to flat year over year. What changed is purchasing power: the same dollars buy less than they did in 2022, so a flat nominal price represents a modest real decline.

Ahwatukee at a glance — July 2026

Metric July 2026 Year earlier
Median sale price, single-family ~$550,000 ~$559,500
Days on market See below — two measures
Sale-to-list ratio ~99%
New listings +6.4% year over year
Months of inventory ~3.1 (balanced)

A caution on Ahwatukee statistics. Published figures for this market vary widely by source — reported days on market for 2026 ranges from 26 to 76 days depending on the provider, the date range, and whether condominiums and townhomes are included. Ahwatukee is not one market; 85044, 85045 and 85048 behave differently, and blended numbers obscure that. Any figure you see quoted for "Ahwatukee" should be checked for what it actually counted.

Why local inflation matters more than the national number

Phoenix-area inflation ran 3.0% in the year to April 2026, below the national rate of 3.8%. The housing component diverged even more sharply: local housing inflation was 1.2% against 3.6% nationally. The Bureau of Labor Statistics publishes the Phoenix-area index directly if you want to check the underlying series.

That gap is the reason national coverage is a poor guide to what is happening on your street. A story built on national CPI and a national price index describes an average of hundreds of markets, and averages describe none of them.

How long does it take to sell a home in Ahwatukee?

It depends entirely on which number you are being quoted, and this is the most commonly misreported statistic in the Ahwatukee real estate market.

There are two "days on market" figures. They measure different things, they differ by roughly a factor of three, and almost nobody publishing them says which one they used.

Measure Sold days on market Active days on market
What it counts Homes that actually closed — how long each took to go under contract Homes currently listed — how long each has been sitting so far
Ahwatukee, current Around three weeks Roughly three times higher
What it tells you How fast a correctly priced home moves How long an overpriced home lingers
Who quotes it Agents describing market speed Reports describing market softness
The catch Excludes every home that never sold Counts the same stale listing again every month

The gap between those two numbers is the entire story of this market. Homes that are priced correctly leave quickly, which is why the sold figure is low. Homes that are priced optimistically stay, accumulate days, and push the active figure up. The market is not slow. It is selective — and the selection happens in week one, at the pricing decision.

This is also why published figures for Ahwatukee vary so wildly between sources. Reported values for 2026 range from the low twenties to well past seventy depending on which measure the publisher used, whether condominiums and townhomes were included, and which date range was pulled. Any figure you see quoted should be checked for what it actually counted.

What this means if you are thinking about selling

The practical read: the market will not punish you slowly. It will either engage in the first two weeks or it will pass.

That matters because the cost of an initial overprice is not the price reduction you eventually make. It is what happens while you wait to make it. A listing that sits accumulates days on market that every buyer's agent can see, and a home that has been available for two months invites a different opening offer than the same home in its first week — regardless of what it is actually worth.

Correcting an overprice therefore costs considerably more than pricing correctly at launch. Not because the market is unforgiving, but because the first two weeks are the only period in which your home is genuinely new to everyone looking.

Is 2026 a good time to sell a home in Ahwatukee?

Conditions are balanced rather than favoring either side. Inventory has risen and homes take longer to sell, but sale-to-list ratios near 99% show buyers are still transacting. The decision depends more on individual equity position and timing than on market direction.

Three things follow from the inflation-adjusted picture, and they cut in different directions depending on when you bought:

  • If you bought before 2020, your real gain is still substantial even after adjustment. The 2020–2022 run-up was large enough that inflation has not eroded it.
  • If you bought at or near the 2022 peak, you are likely close to flat in nominal terms and modestly behind in real terms. Principal paydown since purchase partly offsets this, and it is the part most owners never count.
  • If you are holding rather than selling, the real decline is a paper figure. It matters only at the point of transaction, and it matters far less if you are buying another home in the same market — you sell and buy in the same dollars.

What this does not tell you

Index figures describe a metro area of nearly five million people. Your home is one property on one street, and index-level analysis cannot account for the things that actually set your price: condition, lot position, layout, school boundary, and which specific homes have sold near you recently.

Automated valuation tools have the same limitation. They are built from broad averages and public records, and they do not know your roof is three years old or that the two most recent comparable sales on your street were both single-level with three-car garages — which changes your comparable set entirely.

Sources and method

Method. Real values were calculated by deflating nominal index values using Phoenix-area CPI-U, rebased so that the earliest period in each comparison equals its nominal value. Figures are rounded. Housing indices are revised periodically; figures reflect data available as of 12 August 2026.

Rachael Richards is the founder and Designated Broker of R·House Realty, serving Ahwatukee and the surrounding Phoenix metro area. Doing real estate the right way.

This article is general market information, not financial, tax, or investment advice. Market data is subject to revision. Consult a qualified professional before making decisions about your property.

Posted in Real Estate News
July 30, 2026

Ahwatukee Seller Insights

Ahwatukee Seller Insights · July 2026

What Ahwatukee Home Sellers Should Know in 2026: The Local Numbers Behind the Headlines

Sales volume is up nearly 35% year-over-year. Homes take about two months to sell. Correctly priced ones go in half that. Here's what that actually means if you're thinking about listing.

If you're thinking about selling in Ahwatukee, you've probably run into two contradictory stories. One says the housing market is falling apart. The other says it's never been a better time to list. Neither one describes what's actually happening here.

The real picture is less dramatic than either — and considerably more useful. More homes are selling in Ahwatukee than a year ago. Most take roughly two months. The ones priced correctly go under contract in about half that time. That gap, between the average home and the correctly priced one, is the single most important thing for a seller to understand right now, and it's the thing national headlines can't tell you.

+34.7%Homes sold vs. Jun 2025
70 daysAvg. days on market, Jun 2026
98%Of list price received
· Start Here

Why National Headlines Don't Describe Ahwatukee

National housing coverage averages together markets that have nothing in common. A slowdown in one metro and a boom in another cancel each other out into a number that describes neither. Ahwatukee is a specific place — three zip codes (85044, 85045, and 85048) that carry Phoenix mailing addresses but function as their own distinct village, separated from the rest of the metro by South Mountain Park, with its own schools, trail access, and buyer profile.

Here's a concrete example of why the source matters. If you look up Ahwatukee on a national real estate portal, you may see a median sale price near $431,000 and homes sitting 76 days. Pull the same period from MLS-sourced single-family data and you get a median around $575,000 and 70 days. Neither is lying. They're drawing different boundaries around "Ahwatukee" and blending different property types — condos and townhomes pull a median down considerably.

This is worth knowing before you form an opinion about your own home's value from a website. When we talk about numbers below, we're using MLS-sourced single-family data, because that's what's comparable to most Ahwatukee sellers' situations.

· The Overlooked Signal

Transaction Volume Is Up Sharply — And Most Sellers Miss It

Days on market gets all the attention. Volume is the better demand signal, and it's the strongest number in this market by a wide margin.

Month, 2026 Homes sold Vs. same month 2025
March 94 +36.2%
April 89 +18.7%
May 85 −2.3%
June 101 +34.7%

Three of the last four months posted double-digit increases in closed sales versus the prior year. June alone closed 101 single-family homes, up from 75 a year earlier. That is not the profile of a market where buyers have disappeared. Buyers are here, they're active, and there are meaningfully more of them completing purchases than there were twelve months ago.

If your hesitation about listing is rooted in "nobody's buying right now," the local data simply doesn't support that concern.

· Time on Market

What 70 Days Actually Means for Your Listing

Let's be straightforward about this one, because it's where a lot of seller anxiety lives. Homes in Ahwatukee are taking about two months to sell, and that's roughly flat compared to last year — not deteriorating, but not the multiple-offers-in-a-weekend market of 2021 either.

Month, 2026 Avg. days on market Same month, 2025
March 55 49
April 61 65
May 60 60
June 70 70

Two things are true at once here, and sellers who only hear the first one make expensive decisions. Yes, the average is around two months. But homes that are priced correctly are still going pending in about 32 days or less — under half the average. One brokerage tracking Ahwatukee inventory found average days on market improving to 62 days, down from 74 three months prior, and attributed the difference specifically to homes that were well-priced and well-presented.

That spread is the whole story. The average includes homes that launched above what the market would bear, sat, and then chased the market downward with price cuts. It also includes homes that were priced right and gone in a month. Your listing doesn't have to be the average — but the gap only closes in your favor if the pricing is right from day one.

· Reading Prices Honestly

Why One Month's Median Price Tells You Almost Nothing

This is the part most market updates get wrong, and it's worth being honest about. Look at Ahwatukee's median sale price over four consecutive months:

Month, 2026 Median sale price Vs. year prior
March $589,150 +3.9%
April $566,500 −1.5%
May $570,000 +4.6%
June $575,000 −8.4%

Four months, four different directions. If someone wanted to tell you the Ahwatukee market is booming, they'd quote May. If they wanted to alarm you, they'd quote June. Both would be citing real numbers, and both would be misleading you.

What's actually happening is a mix shift. Ahwatukee is a relatively small market where a handful of high-end sales in a given month move the numbers noticeably. In June, the median fell 8.4% while the average sale price climbed to $760,107 — those move in opposite directions when the composition of what sold changes, not when every home in the neighborhood suddenly gained or lost value. A month with several multi-million-dollar hillside sales looks nothing like a month without them.

What this means for youMonthly median price movement is not a reading on your home's value. Your home's value comes from recent comparable sales of similar properties in your specific area and price band — not from a neighborhood-wide median that swings on which luxury homes happened to close that month.
· Pricing Power

Sellers Are Still Getting 98% of List Price

Here's the number that should reassure most Ahwatukee sellers more than any headline: homes in this market are selling at approximately 98% of list price, in conditions best described as balanced-to-seller-favorable.

A 2% gap between asking and closing is a normal, healthy negotiation — not a market forcing sellers into deep concessions. It means well-positioned listings are holding their ground on price. The catch, again, is that this figure applies to homes priced in line with the market. A home listed 10% above what comparable sales support doesn't sell at 98% of that inflated number; it sits, accumulates days on market, and eventually sells below where it would have if it had launched correctly.

· Supply

Inventory: What 3.1 Months Means for Your Leverage

As of late May 2026, Ahwatukee had roughly 183 active single-family listings and about 3.1 months of inventory.

Months of inventory is simply how long it would take to sell every home currently listed at the current pace of sales. The conventional read: under about four months tilts toward sellers, four to six is balanced, and above six favors buyers. At 3.1 months, Ahwatukee still sits on the seller-favorable side of neutral — with more competition than the extreme scarcity of a few years ago, but nothing resembling an oversupplied market.

Practically, that means buyers have real choices, and your home needs to be one of the better options in its price band rather than simply being available.

· What You Control

Pricing Strategy Is the Variable That Decides Your Outcome

Put all of it together and a clear conclusion emerges. You can't control interest rates, national sentiment, or how many hillside estates close this month. What you can control is how your home enters the market.

  • Correctly priced homes are selling in about 32 days, while the market average sits near 70. That difference is almost entirely a pricing and presentation decision.
  • Sellers are achieving about 98% of list when the list price is credible to begin with.
  • Buyer demand is genuinely strong, with sales volume up roughly 35% year-over-year in the most recent month.
  • Overpricing is more costly than it used to be. In a market with 3.1 months of supply, a listing that sits becomes visibly stale, and buyers notice accumulated days on market.

Timing the market is largely out of your hands. Pricing your specific home against real, recent, comparable Ahwatukee sales is entirely within them — and in this market, it's the decision that matters most.

Find Out What Your Ahwatukee Home Is Actually Worth

A real valuation based on recent comparable sales in your neighborhood and price band — not a website estimate or a neighborhood-wide median.

Request Your Home Valuation
· Frequently Asked Questions

Is it a good time to sell my house in Ahwatukee?

Conditions are workable for well-prepared sellers. Sales volume rose nearly 35% year-over-year in June 2026, homes are achieving about 98% of list price, and inventory sits near 3.1 months — slightly seller-favorable. Homes take about 70 days on average, though correctly priced ones go under contract in roughly 32 days.

What is the average days on market for homes in Ahwatukee, AZ?

Ahwatukee single-family homes averaged about 70 days on market in June 2026, essentially unchanged from the same month a year earlier. Earlier in 2026 the figure ranged from 55 to 61 days. Homes priced in line with comparable sales typically go pending in about 32 days or less.

Are Ahwatukee home prices going up or down?

Neither cleanly. Ahwatukee's median sale price moved between roughly $566,500 and $589,150 across March–June 2026, swinging positive and negative year-over-year in different months. Those swings mainly reflect which price segments happened to sell, not broad changes in home values.

How long does it take to sell a home in Ahwatukee?

Plan for roughly two months from listing to contract based on current averages, though this varies widely by pricing. Well-priced, well-presented homes commonly go pending within about a month, while homes listed above market frequently exceed the average significantly.

Why do online estimates for Ahwatukee homes differ so much?

National portals and MLS-sourced reports define Ahwatukee's boundaries differently and blend property types differently. Portal data including condos and townhomes can show a median near $431,000, while MLS single-family data for the same period shows roughly $575,000.

Sources

Market figures reflect data available as of July 2026 and are subject to change. Monthly statistics are blended across all of Ahwatukee and are not a substitute for a property-specific comparative market analysis. This article is for general information only and is not financial or investment advice.

Posted in Home Selling
July 23, 2026

Ahwatukee Housing Market Forecast: What Buyers Should Know Before Waiting for Lower Rates

Ahwatukee Market Analysis · July 2026

A data-backed look at what delaying an Ahwatukee home purchase actually costs — and why the math rarely works out the way buyers expect.

Are you an Ahwatukee homebuyer sitting on the sidelines, hoping mortgage rates drop before you commit? It's a reasonable instinct — nobody wants to lock in a rate today only to watch it fall next year. But when we run the actual numbers for this market, waiting rarely delivers the savings buyers expect. Here's what the data says, and what it means for your timeline.

·The Ahwatukee Market Today

Rates, Inventory, and What They Mean for Buyers Right Now

As of mid-July 2026, the average 30-year fixed mortgage rate sits at 6.55%, according to Freddie Mac's weekly Primary Mortgage Market Survey — up slightly from 6.49% the week before, but still meaningfully below the 6.75% recorded this time last year. In other words, rates haven't moved much in either direction; they've been trading in a narrow band since mid-spring. That's worth sitting with, because it means the dramatic rate drop many buyers are waiting for hasn't materialized, and there's no clear signal that it's imminent.

6.55%Avg. 30-yr rate, Jul 2026
$575KAhwatukee median sale, Jun 2026
85044 / 85045 / 85048Ahwatukee zip codes

Ahwatukee itself tells a slightly more nuanced story than the national headlines. The median sale price for single-family homes came in at $575,000 in June 2026 — modestly softer than a year ago — while the average sale price climbed to $760,107, up over 4% year-over-year. Those two numbers moving in different directions isn't a contradiction; it reflects a mix shift, with a stronger share of higher-end sales pulling the average up while pricing for the typical, mid-market listing has actually eased. For a buyer shopping in the median range, that's a more favorable entry point than the average alone suggests. Ahwatukee sits across zip codes 85044, 85045, and 85048, and while it carries Phoenix addresses, it functions as its own distinct community, separated from the rest of the metro by South Mountain Park — its own schools, trail systems, and micro-market.

Across the broader Phoenix metro, inventory has been rising and the market has shifted away from the intense competition of a few years ago, back toward something closer to historical balance. For buyers, that means more room to negotiate than the market has offered in a while — a condition that tends to compress as soon as affordability improves and buyers who were priced out start returning at scale.

·The Wait-and-See Question

Why "Waiting for a Crash" Is the Wrong Frame

The three major national forecasters — the National Association of Realtors, Realtor.com, and Zillow — all point to slow, continued improvement in housing conditions through the rest of 2026, not a downturn. None of them are forecasting the kind of price correction that would make delaying a purchase pay off on its own. Realtor.com's own economists have flagged one of the clearest reasons why: roughly four out of five current homeowners are sitting on mortgage rates below 6%. That "lock-in effect" means far fewer owners have a financial incentive to sell, which keeps the supply of homes for sale constrained even as buyer demand improves — a dynamic that supports prices rather than undermining them.

There's a second layer to this worth naming directly: if rates do fall in a meaningful way, expect it to bring a wave of previously priced-out buyers back into the market at the same time. Realtor.com's chief economist has pointed out that a rate drop tends to invite more competition, not less — and that buyers who purchase ahead of that shift retain the option to refinance later if rates do ease. In practice, that means today's calmer, more negotiable market may be the better window to buy in, with refinancing available downstream if the rate environment improves.

·Scenario 1

If Rates Drop and Prices Rise

Here's where the math becomes concrete. Consider a hypothetical Ahwatukee buyer looking at a home near the current median of $575,000, putting 20% down.

Buy Now   Wait 12 Months  
Home price $575,000 Home price (+4% appreciation) ~$598,000
Down payment (20%) $115,000 Down payment (20%) ~$119,600
Rate 6.55% Rate (hypothetical drop) ~6.10%
Est. monthly P&I ~$2,920 Est. monthly P&I ~$2,900

Notice what happens: even with a meaningful rate improvement, the monthly payment barely moves. The buyer who waited needed roughly $4,600 more cash at closing, and spent a year without the equity growth, principal paydown, or appreciation they'd have captured by owning the home already — on top of whatever they paid in rent during that year. The rate drop they were hoping for essentially got absorbed by the higher price.

A note on these numbersThis is an illustrative example using rounded, hypothetical figures to show how the math tends to work — not a quote or a guarantee for any specific property or buyer. Actual payments depend on credit profile, loan type, taxes, insurance, and the rate available at the time. Always run your specific numbers with a licensed loan officer before making a decision.
·Scenario 2

If Rates Stay Flat and Prices Inch Up

The second scenario is simpler, and arguably more likely given how flat rates have been since spring: rates hold roughly where they are, while typical appreciation of 2–3% continues. In that case, the buyer who waited gets no rate benefit at all — they simply pay more for the same home a year later, with nothing to offset it. The only thing that improves is the number of listings to choose from, not the underlying affordability.

·The Full Picture

Breaking Down the Real Cost of Waiting

Put together, the true cost of delaying a purchase in a market like Ahwatukee's isn't just "will rates be lower." It's the sum of several things happening at once:

  • Extra purchase price from ordinary appreciation during the wait.
  • Lost principal paydown — every month renting or waiting is a month not building home equity.
  • Lost appreciation on a home you don't yet own.
  • Rent paid in the meantime, if applicable, which builds no equity at all.
  • A larger down payment requirement as the purchase price climbs.

None of these show up on a mortgage rate chart, which is exactly why "just wait for rates to drop" undersells what's actually at stake.

·The Strategic Alternative

The Power of Refinancing — A Move, Not a Waiting Game

Buying now doesn't mean committing to today's rate forever. The standard industry guidance is that refinancing tends to make sense once you can shave 1–2 percentage points off your existing rate — with closing costs typically running 2–3% of the loan balance, most buyers reach their break-even point within about a year of refinancing. That makes "buy now, refinance later" a genuinely useful strategy for buyers who are comfortable with today's payment and simply want the flexibility to improve it later.

It's worth being honest about the limits of this approach, too: when a similar strategy became popular in 2022, many buyers who planned to refinance quickly found that rates stayed elevated far longer than expected. The lesson isn't that buying now is a mistake — it's that you should only buy at a payment you can comfortably afford without assuming a future rate drop. A refinance, if it comes, should be a bonus, not the plan.

·What the Spreadsheet Misses

Beyond Rates: The Intangible Costs of Delaying

There's a cost to waiting that doesn't show up in any calculation: another year in a rental that isn't yours, another year of school-district uncertainty if you're planning around kids, another year of not being able to make a house your own. For buyers who are financially ready, the emotional and logistical toll of an indefinite "just a little longer" often outweighs whatever rate movement they're hoping to catch.

·Your Next Step

Is Now the Right Time for You to Buy in Ahwatukee?

Market data can tell you what's true for Ahwatukee as a whole. It can't tell you whether now is right for your specific situation — that depends on how long you plan to stay, whether today's payment fits comfortably in your budget, and what you're hoping to find in a home. The data above suggests that waiting rarely pays off the way it seems like it should. Whether that holds true for you specifically is worth a real conversation, not a guess.

Ready to Stop Guessing and Start Building Equity?

Let's crunch your numbers and build a plan around your timeline, budget, and the Ahwatukee neighborhoods you actually want to live in.

Schedule Your Strategy Session
·Frequently Asked Questions

What happens if I wait to buy a house in Ahwatukee?

Waiting typically means paying more for the same home due to ordinary appreciation, while losing a year of equity growth, principal paydown, and any rent paid in the meantime. Unless rates drop enough to fully offset the higher price, most buyers end up with a similar or higher monthly payment than if they'd bought sooner.

Is it better to buy now or wait for rates to drop in Ahwatukee?

For buyers who are financially ready and plan to stay several years, buying now and refinancing later — if rates fall — tends to outperform waiting. A rate drop alone rarely offsets the combined cost of a higher price, lost equity, and a larger down payment a year from now.

How much does waiting for lower mortgage rates cost in Ahwatukee?

Based on current Ahwatukee pricing and typical appreciation, waiting a year can mean a few thousand dollars more in down payment alone, plus a year of missed equity growth and appreciation — often enough to offset any savings from a modestly lower rate.

What's the Ahwatukee real estate market timing advice for 2026?

National forecasters expect slow, steady improvement through 2026 rather than a price correction. With most current homeowners holding rates below 6%, inventory is likely to stay tight, meaning buyers waiting for a supply-driven price drop may be waiting on a scenario that doesn't materialize.

How do current Ahwatukee home prices compare to mortgage rates?

Ahwatukee's median single-family sale price was $575,000 as of June 2026, against a 30-year fixed rate averaging 6.55%. Median pricing has softened slightly year-over-year even as average sale prices rose, reflecting a shift toward more higher-end sales rather than broad-based appreciation.

Sources

Figures reflect data available as of July 2026 and are subject to change. This article is for general information only and is not financial, lending, or investment advice — consult a licensed loan officer or financial advisor for guidance specific to your situation.

Posted in Buying a Home
July 15, 2026

2026 Ahwatukee Mid-Year Real Estate Market Update: What Homeowners Need to Know Now

Ahwatukee Market Report · July 2026

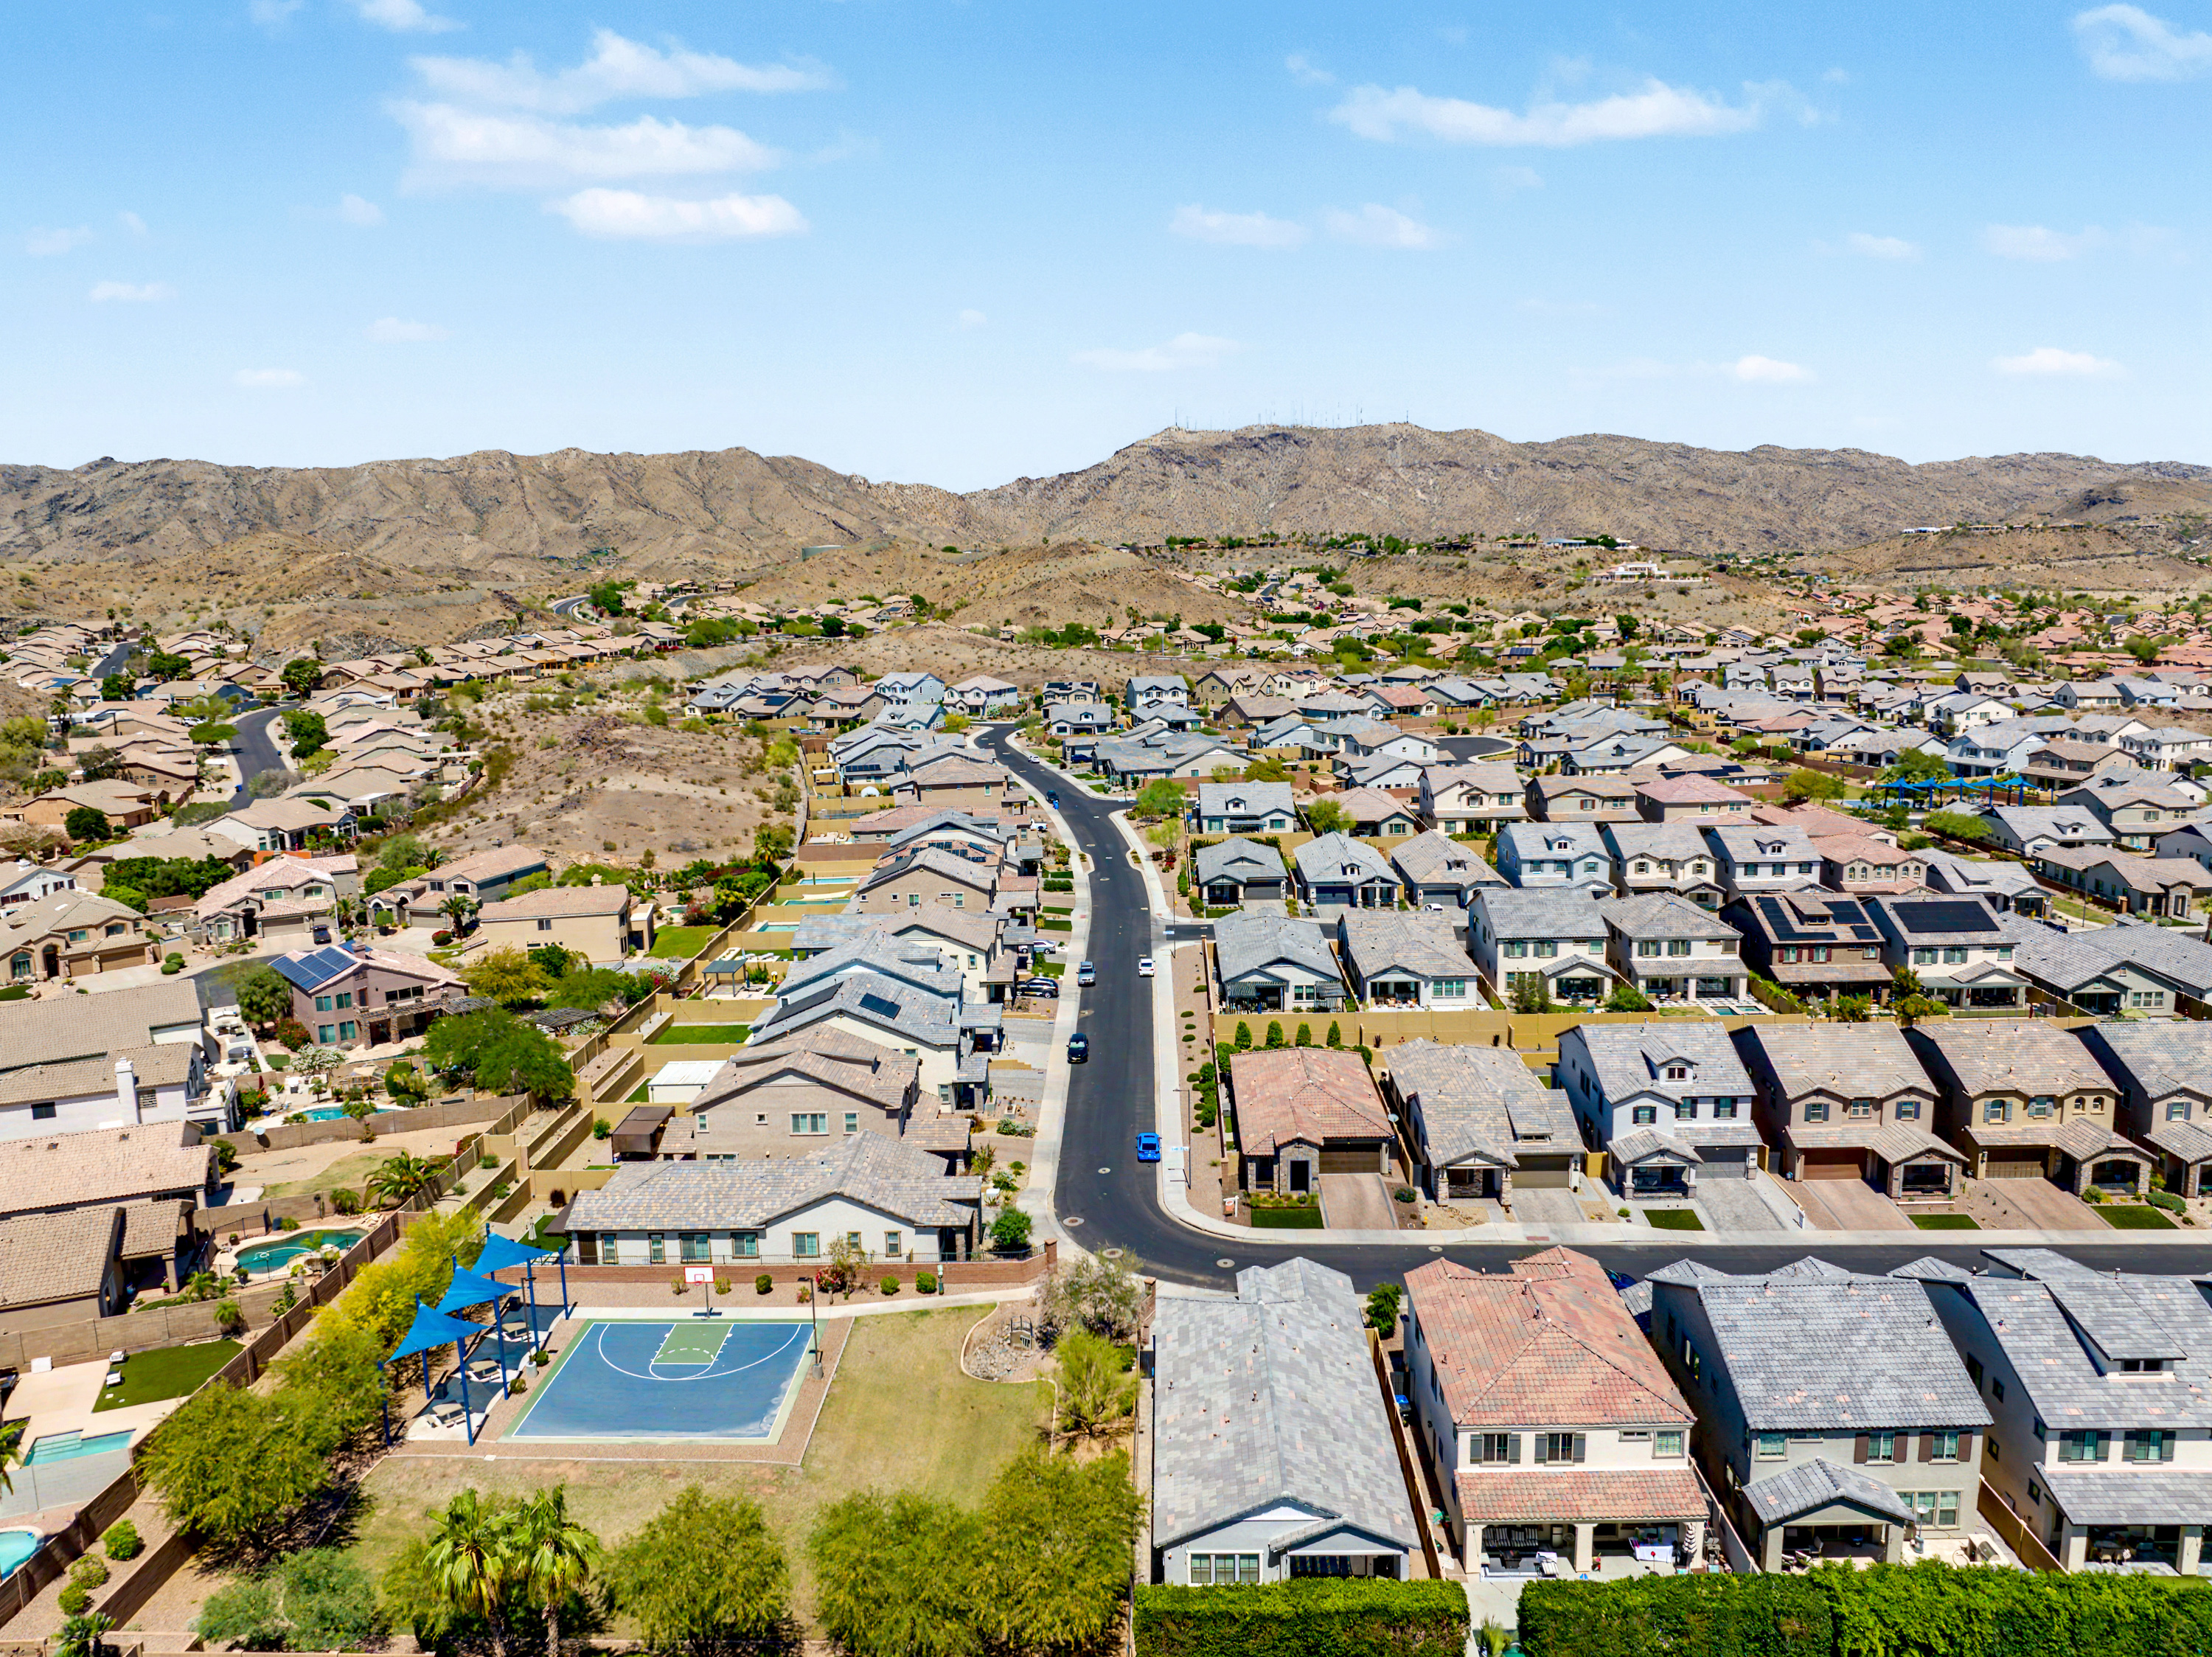
Aerial view of an Ahwatukee Foothills neighborhood with South Mountain Preserve in the background

If you own a home in Ahwatukee, the first half of 2026 probably left you with mixed signals. National headlines say home prices have gone flat. Your neighbor's house sold in three weeks. A friend in Chandler had to offer closing-cost credits to get a deal done. So which is it?

All of it, actually — and the details matter. We went through the mid-year numbers for 85044, 85045 and 85048, checked them against Valley-wide and national data, and linked every figure to its source so you can verify anything in this report yourself. Here's what the first half of 2026 actually looked like in Ahwatukee, and what it means depending on where you sit: thinking of selling, sizing up a move, weighing a refinance, or simply keeping an eye on your biggest asset.

How to read this report: Local figures come from MLS data for single-family homes; Valley-wide figures come from the Cromford Report; national figures come from NAR, Freddie Mac and Zillow. Where sources disagree or data isn't available at the neighborhood level, we say so directly rather than papering over it.

Ahwatukee by the Numbers: Mid-2026

Per MLS statistics for May 2026 (FlexMLS, reported June 2026), Ahwatukee's single-family market posted:

$570,000
Median sale price — up 4.6% from $545,000 in May 2025
60 days
Average days on market — unchanged year over year
−11.2%
New listings vs. May 2025
$282/sqft
Average sold price per square foot, down from $303

Eighty-five single-family homes closed in May — nearly identical to last year's 87 — with an average sale price of $617,064. Five closings topped $1 million, led by a 3,818-square-foot home in 85044 that sold for $1.3 million (MLS data via Swee Ng, HomeSmart).

Notice the tension inside those numbers. The median price rose 4.6%, yet price per square foot fell about 7%. Homes are selling, but at 60 days on market, they're not flying. Read together, the data describes a market where values are holding but buyers have become selective — larger and better-kept homes are driving the median up while negotiation compresses the price of everything else.

ZIP by ZIP: 85044, 85045 and 85048

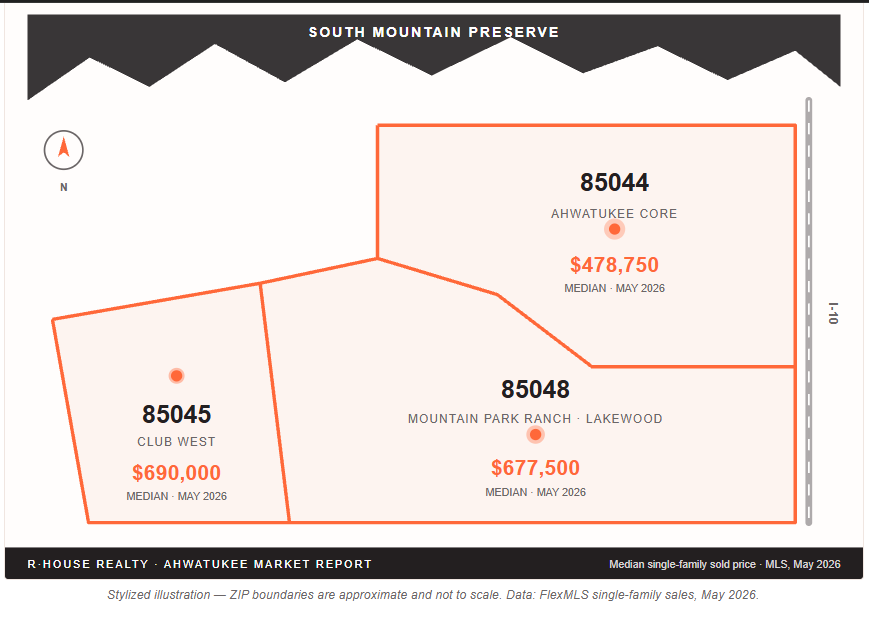
R House Realty Ahwatukee Market Report for May 2026 showing median single family sold prices for ZIP codes 85044, 85045, and 85048. ZIP 85044 Ahwatukee Core median price 478750 dollars. ZIP 85045 Club West median price 690000 dollars. ZIP 85048 Mountain Park Ranch Lakewood median price 677500 dollars. Map includes South Mountain Preserve and Interstate 10 for location context. Data source FlexMLS.

Ahwatukee is really three markets sharing one name. The May 2026 single-family figures (MLS data):

ZIP Code Median Sold Price Average Sold Price
85044 — Ahwatukee's core; highest volume, broadest price range $478,750 $541,376
85045 — Club West area; larger lots, newer construction $690,000 $729,500
85048 — Mountain Park Ranch, Lakewood, golf communities $677,500 $669,732
Where sources disagree: The local Ahwatukee Foothills News reported a May median of $527,500 for 85048 — well below the $677,500 in the MLS single-family table above. The gap likely reflects different property mixes (all home types versus single-family only). Similarly, Redfin's blended all-home-type median for the area runs closer to $535,000 because it folds in condos and townhomes. When you see wildly different "Ahwatukee medians" online, this mix effect is almost always why. For your own home, none of these blended numbers substitute for a comparative analysis of actual sales on your street.

The pattern behind the table is durable: 85044's volume and range keep its median lower, while 85045 and 85048 — Club West, Mountain Park Ranch, Lakewood and the communities backing South Mountain Preserve — hold premiums near $700,000, supported by lot sizes, views and the Kyrene school district, whose local elementary schools rate 8–9 out of 10 on GreatSchools.

The Valley Context: Negotiation Is Back

Greater Phoenix has spent the past two years normalizing, and mid-2026 finds it balanced with a tilt toward buyers. The Cromford Report's demand-to-supply index — where 100 means balance — sits near 80, according to senior housing analyst Tina Tamboer in AZ Big Media's 2026 market outlook. Her framing is worth quoting in full:

"When we say it's a buyer's market, I don't want people to freak out. It's not the kind of buyer's market we saw in 2008. This is a market where buyers can actually negotiate again. That's not a bad thing." — Tina Tamboer, Senior Housing Analyst, The Cromford Report, via AZ Big Media

What negotiation looks like in practice: more than half of Valley transactions between $200,000 and $600,000 now include seller concessions — closing-cost help, rate buydowns, repair credits — per the same Cromford analysis. Tamboer also notes pockets of real softness: some mid-tier Valley neighborhoods remain 10–15% below their pandemic peaks, and condos have struggled where single-family homes offer more space for similar money.

So why aren't prices falling harder? Supply. Nationally, roughly 80% of mortgage holders carry rates below 5% and have little incentive to trade them away — the "lock-in effect" (AZ Big Media). Locally, that effect is amplified by geography: Ahwatukee is built out against South Mountain Preserve, and new listings fell 11.2% year over year in May (MLS data). Scarce supply is the quiet force under Ahwatukee's values.

The National Picture — and Why Ahwatukee Diverges

Nationally, the market is grinding sideways at record price levels. The National Association of Realtors reported the median existing-home price hit an all-time high of $440,600 in June 2026, up 1.8% year over year — the 36th straight month of annual gains — even as sales dipped 2.4% from May. NAR chief economist Lawrence Yun attributes the choppiness to affordability: "The back-and-forth in monthly home sales activity, driven by mild fluctuations in mortgage rates, shows how sensitive home buyers are to affordability conditions."

Forecasters expect little movement from here. Zillow's June 2026 forecast projects national home values to rise just 0.1% across 2026 — revised down from earlier estimates — with rising inventory keeping a lid on growth. Redfin's outlook lands in the same neighborhood at roughly 1%, calling it a gradual reset rather than a correction.

Flat nation, rising Ahwatukee — can both be true? Yes, and it's worth being honest about the caveat. Ahwatukee's 4.6% median gain outpaces every national forecast, and part of that gap is real (tight local supply, strong schools, Phoenix job growth) while part may be mix — a month heavier in larger homes lifts the median without any individual home gaining value. The falling price-per-square-foot figure suggests mix is doing some of the work. One month of ZIP-level data is a reading, not a trend.

Rates and Refinancing: The Mid-6s Reality

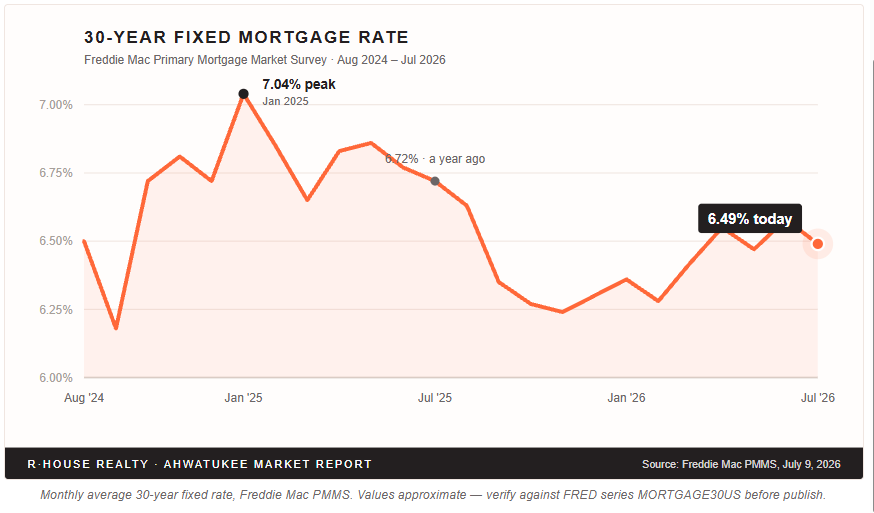
Line chart showing the 30 year fixed mortgage rate from August 2024 to July 2026 based on the Freddie Mac Primary Mortgage Market Survey. The chart highlights a peak rate of 7.04 percent in January 2025 and a rate of 6.72 percent one year ago. The current mortgage rate is 6.49 percent as of July 2026.

The 30-year fixed averaged 6.49% in Freddie Mac's July 9, 2026 survey, down from 6.72% a year earlier. Rates have spent most of 2026 oscillating in the low-to-mid 6s — and per Tamboer, that stability matters more than the level: buyers move when they trust today's rate will still be there tomorrow (AZ Big Media).

Refinancing has quietly come back to life. Refinance applications were running about 20% ahead of last year's pace in June, per Mortgage Bankers Association survey data, and the refi share of all mortgage applications has swung between roughly 37% and 57% this year as rates moved. Who's refinancing? Mostly homeowners who bought or refinanced when rates were near or above 7% in 2023–2024. If that's you, the mid-6s may be worth a conversation. If you hold a pre-2022 rate below 5% — as most longtime owners do — a rate-and-term refinance rarely pencils, though equity-based options are a different discussion. We're not lenders, and none of this is financial advice; it's the context you need to ask a lender the right questions.

Equity: The Number Working in Your Favor

Whatever the monthly headlines say, homeowners are sitting on historic wealth. Mortgage-holding Americans entered 2026 with roughly $17 trillion in collective equity — about $295,000 per borrower. The picture isn't uniformly rosy: property analytics firm Cotality reported the average homeowner gave back roughly $13,400 in equity during 2025 as price growth cooled — a modest retreat from all-time highs, not an erosion of the base. And owners are starting to use it: CNBC reports homeowners tapped $47 billion in equity in Q1 2026, one of the largest quarterly draws since 2008.

For Ahwatukee specifically, the equity story skews stronger than the national average. This is a community of long ownership tenures, and anyone who bought before 2020 — when the area's median was far below today's $570,000 — is likely holding six figures of equity even after the market's recent breather. (Neighborhood-level equity data isn't published; this inference rests on the national figures above and local price history.) That equity is what funds the next move, whether that's the larger home, the lock-and-leave downsize, or the renovation that makes staying put the right call.

What This Means for You

If you're thinking about selling: the winners in this market price to today, not to a 2022 memory. At 60 days average market time, overpricing costs you the crucial first weeks of attention; at $282 per square foot, buyers are paying for condition, so preparation returns real money. Expect concessions in your net sheet from day one — over half of mid-priced Valley deals include them — and remember that with listings down 11.2%, a well-presented Ahwatukee home faces less competition than it has in years.

If you're a move-up buyer: you get the rare both-sides advantage — selling into scarce supply while buying with negotiating power, at rates below last summer's. That alignment doesn't come around often.

If you're downsizing or recently empty-nested: your equity position is the headline. The spread between 85048/85045 prices and smaller single-level homes in 85044 — or elsewhere in the Valley — can free up meaningful capital. The concessions environment also works in your favor on the buy side.

If you're watching your home's value: track the single-family figures, not blended medians, and watch price per square foot alongside the headline number. And treat any single month's ZIP data as one frame of a film, not the whole movie.

"Ahwatukee moves to its own rhythm. We're built out, wrapped around South Mountain, and anchored by schools people move here for — so even when the Valley cools, our supply stays scarce. The homeowners who understand that nuance are the ones who time their move well." — Rachael Richards, Founder, R·House Realty

The Second Half of 2026

The structural forces are visible even if the month-to-month path isn't. Supply stays constrained: the lock-in effect isn't loosening quickly and construction remains limited by labor and financing costs (AZ Big Media). Demand has a floor: the Valley's population has passed 5.2 million, and TSMC, Intel and Mayo Clinic continue expanding payrolls with wages that support homeownership, per the Greater Phoenix Economic Council in the same report. Set against national forecasts of near-flat prices (Zillow), the reasonable expectation for Ahwatukee is steadiness — a market that rewards preparation and punishes autopilot, in both directions.

Frequently Asked Questions

How is the Ahwatukee real estate market performing in mid-2026?

Values are holding firm. MLS data shows a median single-family sale price of $570,000 in May 2026, up 4.6% year over year, with homes averaging 60 days on market. The market is balanced — sellers are gaining ground while buyers negotiate.

What are the median home prices in Ahwatukee by ZIP code?

Per May 2026 MLS data for single-family homes: $478,750 in 85044, $690,000 in 85045, and $677,500 in 85048. Monthly figures move with the mix of homes sold.

Is it a buyer's or seller's market in Ahwatukee right now?

Balanced with a slight buyer tilt. The Cromford Report's demand-to-supply index reads near 80 (100 = balance), and over half of Valley deals between $200,000 and $600,000 include seller concessions.

Is 2026 a good time to refinance?

It depends on your current rate. At 6.49% (Freddie Mac, July 2026), refinancing mainly benefits those who financed near or above 7% in 2023–2024 — national refi activity is running about 20% ahead of last year. Holders of sub-5% rates rarely benefit from a rate-and-term refinance.

How much equity does the average homeowner have?

About $295,000 per mortgage-holding borrower entering 2026, with $17 trillion held collectively — near historic highs despite a modest 2025 dip. Long-tenured Ahwatukee owners typically sit above the national average.

What's the forecast for late 2026?

Steady. National forecasters project near-flat prices; Ahwatukee's tight supply (listings down 11.2%) and Phoenix's job growth support local values.

What do these numbers mean for your home?

Blended medians can miss your home's value by tens of thousands. Get a complimentary valuation built from actual sales on your street — no obligation, no algorithm guesswork.

Get My Free Home Valuation

R·House Realty · Doing real estate the right way. · Serving Ahwatukee & the Valley

Full source list

Statistics reflect data available as of July 15, 2026 and change monthly. This article is general information, not financial, lending or investment advice, and no blended statistic substitutes for a personalized market analysis.

Posted in Market Updates
Dec. 5, 2022

3 Reasons To Sell During the Holidays

There are many benefits for sellers who list during the holiday season.

Are you unsure about listing your house during the holidays? Many homeowners think that it's a bad time to list, but truly it's quite the opposite, especially during the shifting market that we're experiencing right now. Here are three reasons why you shouldn't wait to sell:


1. Listing inventory has decreased. We're currently in a downward trend, as we have 22,000 homes for sale. Sellers have a window of opportunity during the holidays when many people pull their homes off the market. During this time, you have a significant advantage as a seller because there’s less competition. 


2. The median home price has decreased by $55,000 since May. You want to stay ahead in a shifting market to keep the equity that you've built up, so don’t wait. 


3. There will be more competition in January and February. Every year, we have a spike of new listings at the beginning of the year because the homeowners who took their properties off the market during the holidays then put them back on. That flood of new listings means more competition and lower offer prices. 


You have the opportunity to sell your home faster and for more money. Call me at 480-270-5782 and we’ll review all of your options. I look forward to hearing from you. Happy holidays!

Posted in Home Selling
Feb. 21, 2022

Rising Interest Rates and What To Expect

Discussing the impact of rising interest rates on both buyers and sellers.

Today we'll update you on the latest market news, talk about rising interest rates, and discuss what you can expect going forwards.


For the last two years, we've had historically low-interest rates. As those rates start to rise, it's important to understand that they will impact both buyers and sellers. For sellers, you're going to see a decrease in buyer demand and an increase in inventory over time. For buyers, rising rates will decrease your buying power. The house you’re looking at today might not be an option for you in six months.


However, rates will remain comparatively low. In 1981, rates rose to 16.63%. In 2021, they went as low as 2.96%. It's still a great time to buy, and there is a window of opportunity that you want to take advantage of. The Federal Reserve has indicated that they will increase rates on March 2. 


If you're thinking about buying or selling, we can help you explore your options. Reach out to us by phone or email. We'd love to help and look forward to hearing from you.

Posted in Market Updates
Jan. 19, 2022

What Is Causing Our Current Market Conditions?

Here’s why inventory has been so low in our market for so long.


If you’re out looking for a home right now, you already know that there’s not a lot to choose from. How did we get into this low-inventory market, and how are we going to get out of it?


The reality is that we have above-average buyer demand, which is perceived as much higher than it truly is. The real challenge is the chronic and extreme shortage of houses we’ve had. January 2022 has the lowest recorded listing inventory since January 2001. It’s a very challenging market to be a buyer.


"We’ve helped many clients buy and sell in this market."


What’s behind this? For one, builders can’t build quickly enough to keep up with demand. Supply chain issues are causing more and more delays and price increases. A lot of move-up buyers are staying out of the market for now because they’re afraid of not being able to find a replacement home.


We’ve helped many clients buy and sell in the same market. We have a few different programs that we’ve created to help deal with these conditions, and we’d love to tell you about them.


If you have any questions about buying, selling, or real estate in general, don’t hesitate to reach out via phone or email. We look forward to hearing from you soon.

Posted in Market Updates
Nov. 23, 2021

What We Can Learn From Zillow’s Mistakes

Here’s what we can learn from Zillow’s recent home-buying mistakes.


What does the latest Zillow news mean for our market? Let’s talk about it. 


In case you don’t know, Zillow is a website that offers a tool called a Zestimate. They use an algorithm to give you a rough estimate of what your home might be worth. It’s a convenient tool, and you may have even used it yourself. 


However, as real estate agents, we know these Zestimates need to be verified before making any major decisions. If you don’t verify their value, you could end up massively overpaying for a home, which is exactly what happened to Zillow. 


"Always have your home’s value verified by an agent."


They purchased a bunch of homes based on their algorithm, but when they tried to sell them for a profit, they ended up losing millions of dollars. In our opinion, if Zillow can’t trust their Zestimate, then we shouldn’t trust it either. 


Fortunately, we provide home value reports to our clients, and we customize them based on the unique features of your home. If you are looking to sell, make sure you talk to an agent who can verify your home’s value. 


If you have any questions, please reach out to us via phone or email. We are always willing to help!

Oct. 5, 2021

There Is an Opportunity for Sellers Right Now

The fourth quarter is still a great time to sell in our Phoenix market.


Some of you homeowners might be wondering if the fourth quarter is a good time to sell. Traditionally, in the Phoenix market, fall is the second busiest time, second only to spring. As we approach the holidays, many homeowners decide to pull their houses off the market or wait until next year to list.


We have such low inventory as we approach the fourth quarter that it cannot meet the rising demand. You will have less competition and an opportunity to net more money as we approach the holidays.


If you’re curious about your home value, considering selling, or have any other real estate questions, give us a call at (480) 270-5782. We always strive to be a resource for you.

Posted in Home Selling